Histogram
A histogram is a way of summarizing data that are measured on an interval scale
(either discrete or continuous). It is often used in exploratory data analysis to
illustrate the major features of the distribution of the data in a convenient form.
It divides up the range of possible values in a data set into classes or groups. For
each group, a rectangle is constructed with a base length equal to the range of values
in that specific group, and an area proportional to the number of observations
falling into that group. This means that the rectangles might be drawn of non-uniform height.
(Definition taken from Valerie J. Easton and John H. McColl's
Statistics Glossary v1.1)
Example
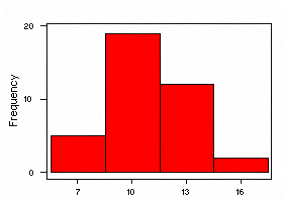
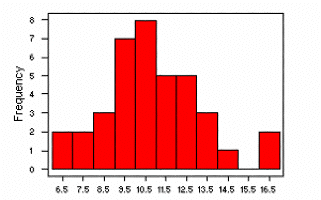
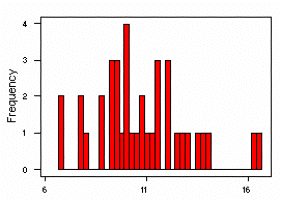
The histograms shown below were created in MINITAB using the following data,
which provide rainfall measurements in inches for six Corn Belt states (Iowa,
Illinois, Nebraska, Missouri, Indiana, and Ohio) from 1890 to 1927:
9.6 12.9 9.9 8.7 6.8 12.5 13.0 10.1 10.1 10.1 10.8 7.8 16.2 14.1 10.6 10.0 11.5 13.6
12.1 12.0 9.3 7.7 11.0 6.9 9.5 16.5 9.3 9.4 8.7 9.5 11.6 12.1 8.0 10.7 13.9 11.3
11.6 10.4
These histograms, created using the MINITAB "HIST" command, present the
data divided into 4, 11 (the MINITAB default), and 40 classes, respectively.
The variation is these histograms illustrates the importance of the
choice of number of classes -- with too few or too many classes, the
histogram does not emphasize the major features of the distribution of the data.
Data source: M. Ezekiel and K. A. Fox, Methods of Correlation and Regression
Analysis, p. 212. Copyright 1959, John Wiley and Sons, Inc., New
York. Data originally from E. G. Misner, "Studies of the
Relationship of Weather to the Production and Price of Farm
Products, I. Corn", mimeographed publication, Cornell University,
March 1928. Data available in S-PLUS 3.3.
RETURN TO MAIN PAGE.


