Scatterplot
A scatterplot is a useful summary of a set of bivariate data (two variables), usually drawn before
working out a linear correlation coefficient or fitting a regression line. It gives a good visual
picture of the relationship between the two variables, and aids the interpretation of the
correlation coefficient or regression model.
Each unit contributes one point to the scatterplot, on which points are plotted
but not joined. The resulting pattern indicates the type and strength of the
relationship between the two variables.
(Definition taken from Valerie J. Easton and John H. McColl's
Statistics Glossary v1.1)
A scatterplot is often employed to identify potential associations
between two variables, where one may be considered to be an explanatory variable
(such as years of education) and another may be considered a response variable
(such as annual income). A positive association between education and income would be
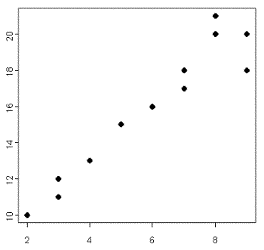
indicated on a scatterplot by a upward trend (positive slope), where higher incomes correspond to higher education
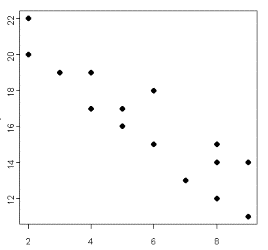
levels and lower incomes correspond to fewer years of education. A negative association
would be indicated by the opposite effect (negative slope), where the most highly educated
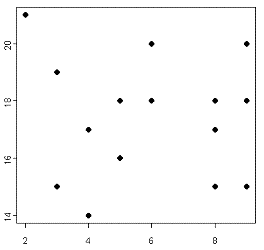
individuals would have lower incomes than the least educated individuals. Or, there might not
be any notable association, in which case a scatterplot would not indicate any trends whatsoever.
The following plots demonstrate the appearance of positively associated, negatively associated,
and non-associated variables:
Example
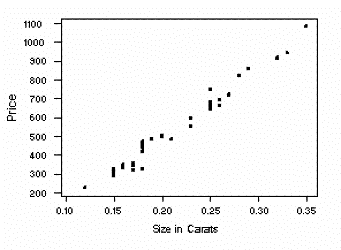
This MINITAB scatterplot displays the association
between the size of a diamond (in carats) and its retail price (in Singapore dollars) for 48
observations. The scatterplot clearly indicates that there is a positive association between
size and price.
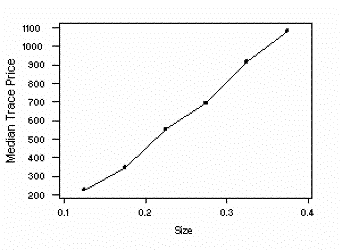 A median trace plot clarifies the positive
assocation between size and price. To create this plot, the horizontal axis (size)
is divided into equally spaced segments, and the median of the corresponding y-values (price)
is plotted above the midpoint of each segment. The points are connected to form the median trace.
Data source: Advertisement placed in the Straits Times newspaper issue
of February 29, 1992, by a Singapore-based diamond jewelry retailer. Dataset available through
the
JSE Dataset Archive.
RETURN TO MAIN PAGE.


 A median trace plot clarifies the positive
assocation between size and price. To create this plot, the horizontal axis (size)
is divided into equally spaced segments, and the median of the corresponding y-values (price)
is plotted above the midpoint of each segment. The points are connected to form the median trace.